

The device at a glance
Opening a device’s containers starts with the device itself: its address, hardware (CPU, memory, OS/architecture), Docker version, and a live count of its stacks, containers, images, volumes, and networks — including how many containers are running, stopped, healthy, or unhealthy.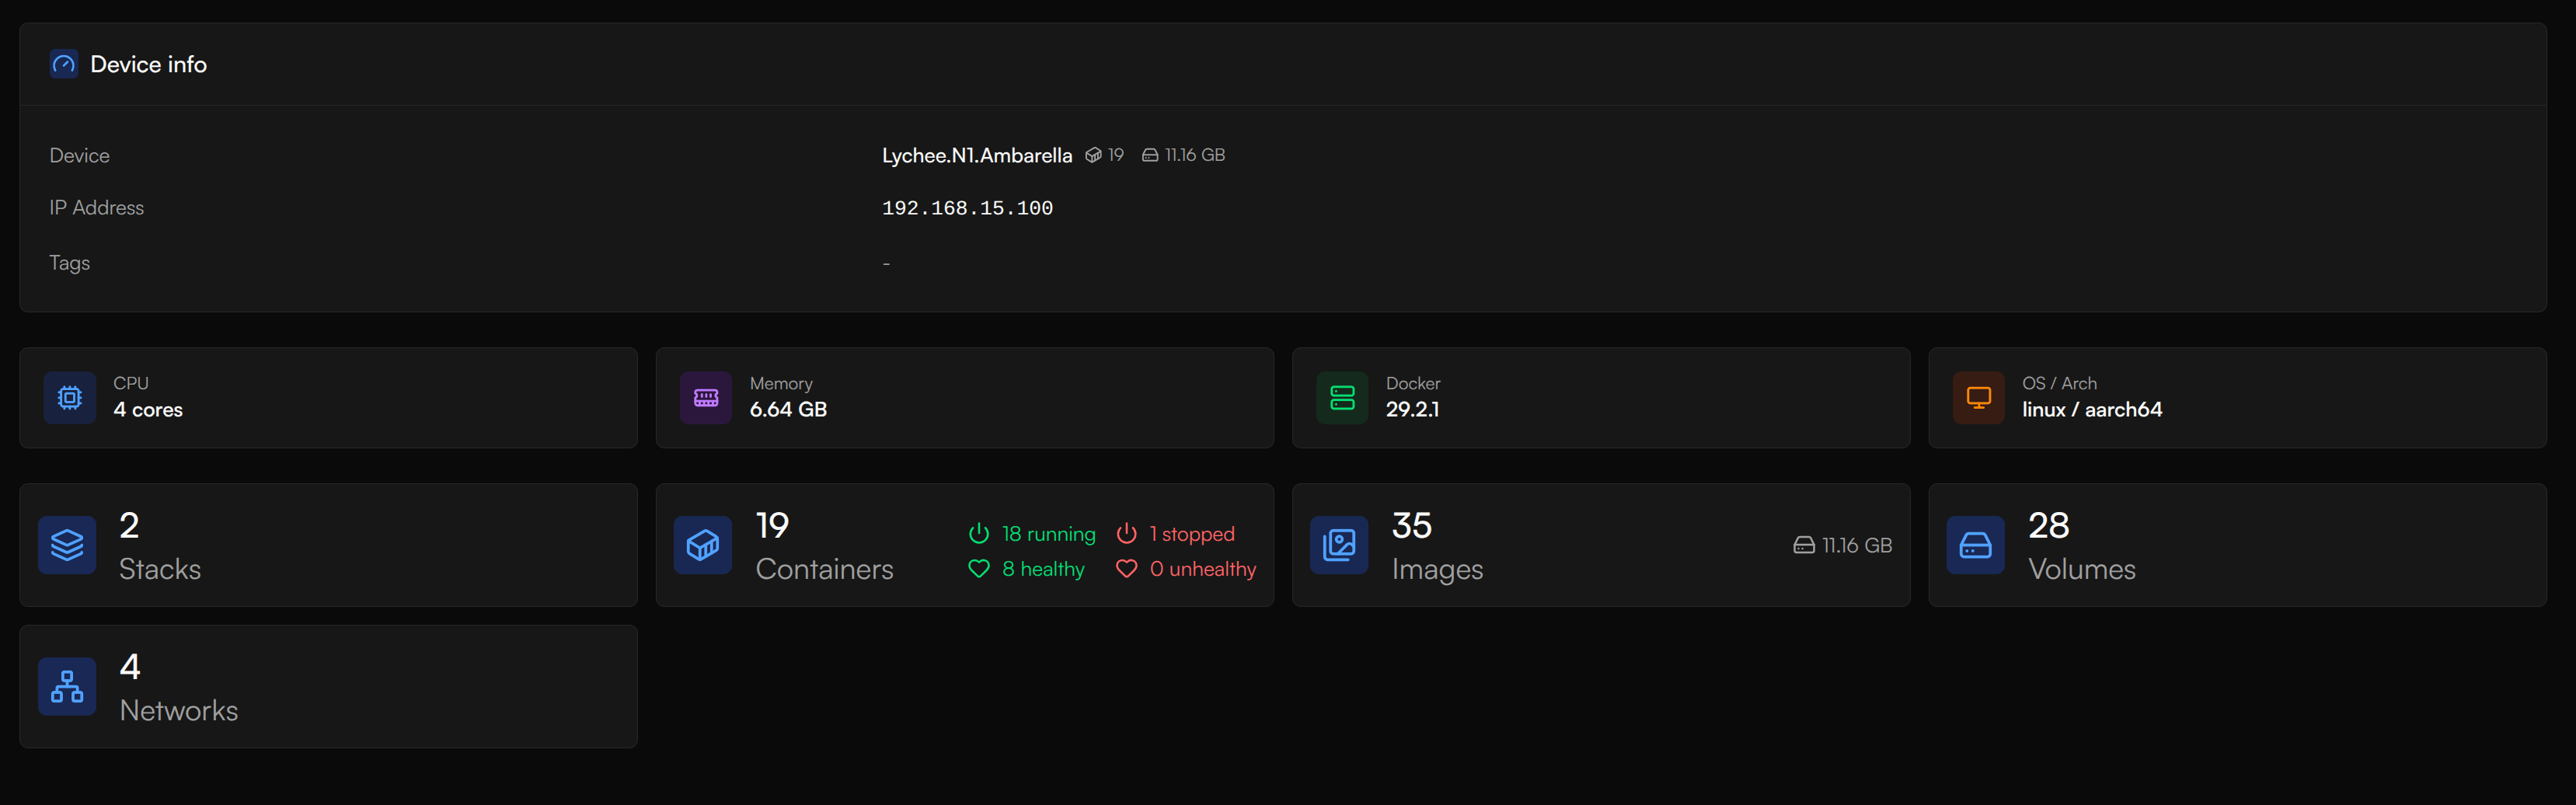
Device overview — hardware, Docker version, and live counts across the device's stacks, containers, images, volumes, and networks.
Containers
Container Management lists everything running on the device — each container’s status and uptime, health, image, published ports, IP address, and the stack it belongs to. Quick actions on every row let you work a container without opening it.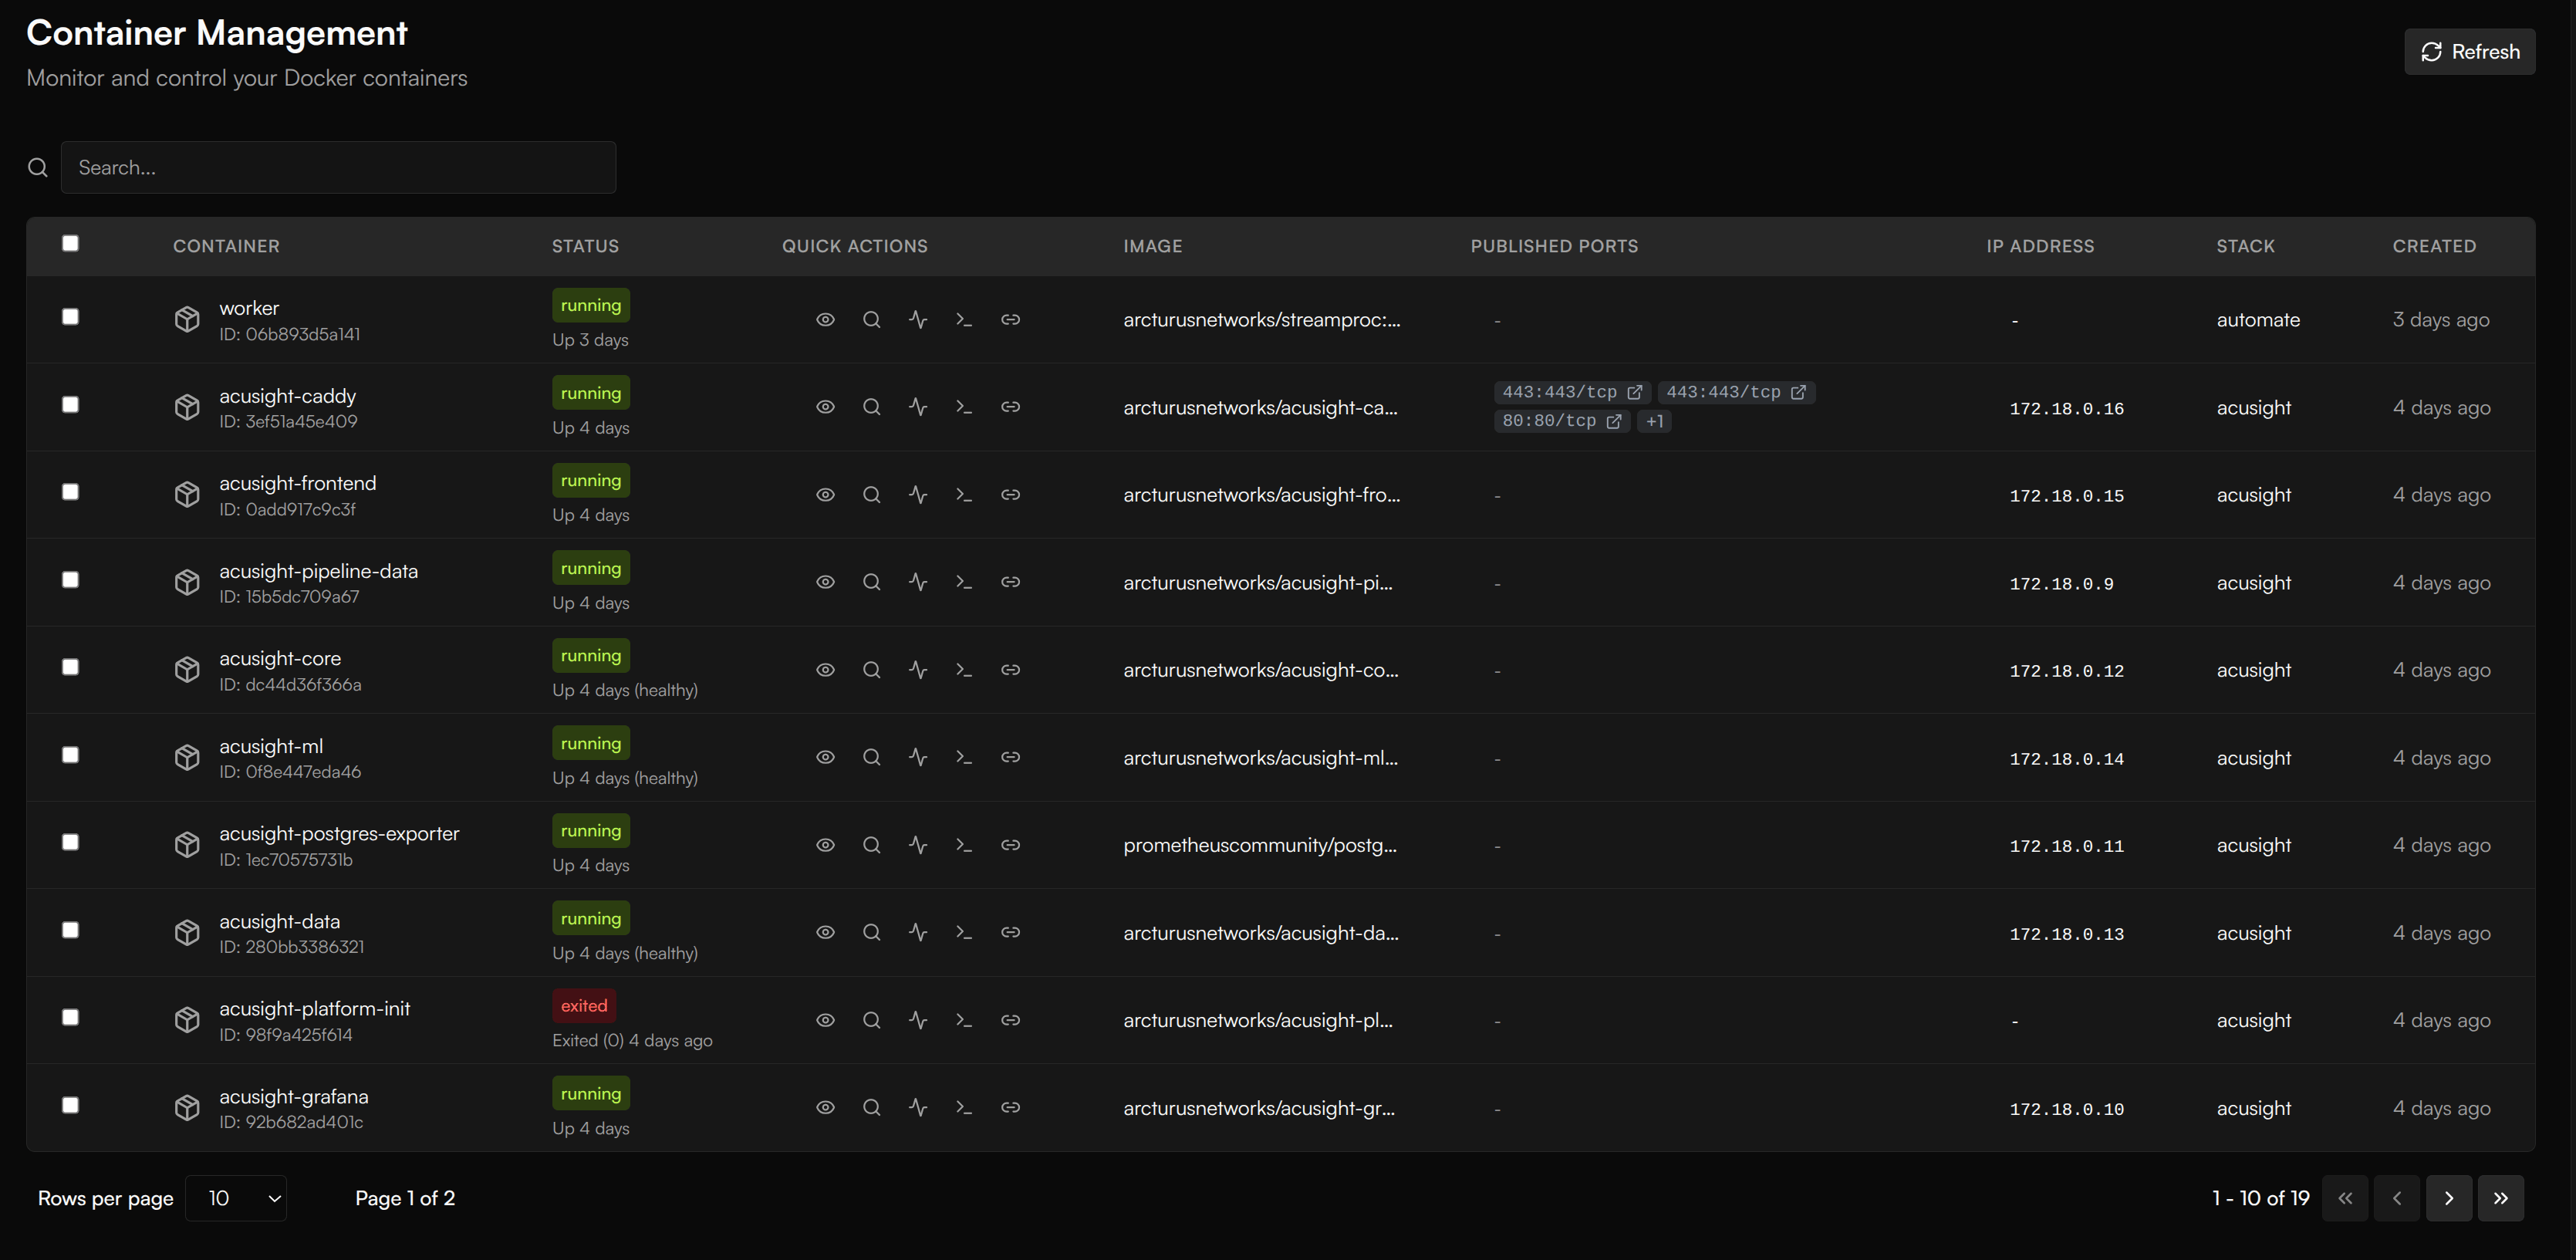
Container Management — every container on the device, with status, health, image, ports, and stack, plus quick actions on each row.
Logs
The Logs tab streams a container’s output straight from the device — the first place to look when something on a device isn’t behaving. You can filter stdout/stderr, toggle timestamps and word wrap, set how many lines to fetch, auto-refresh on an interval, and download the log for offline digging.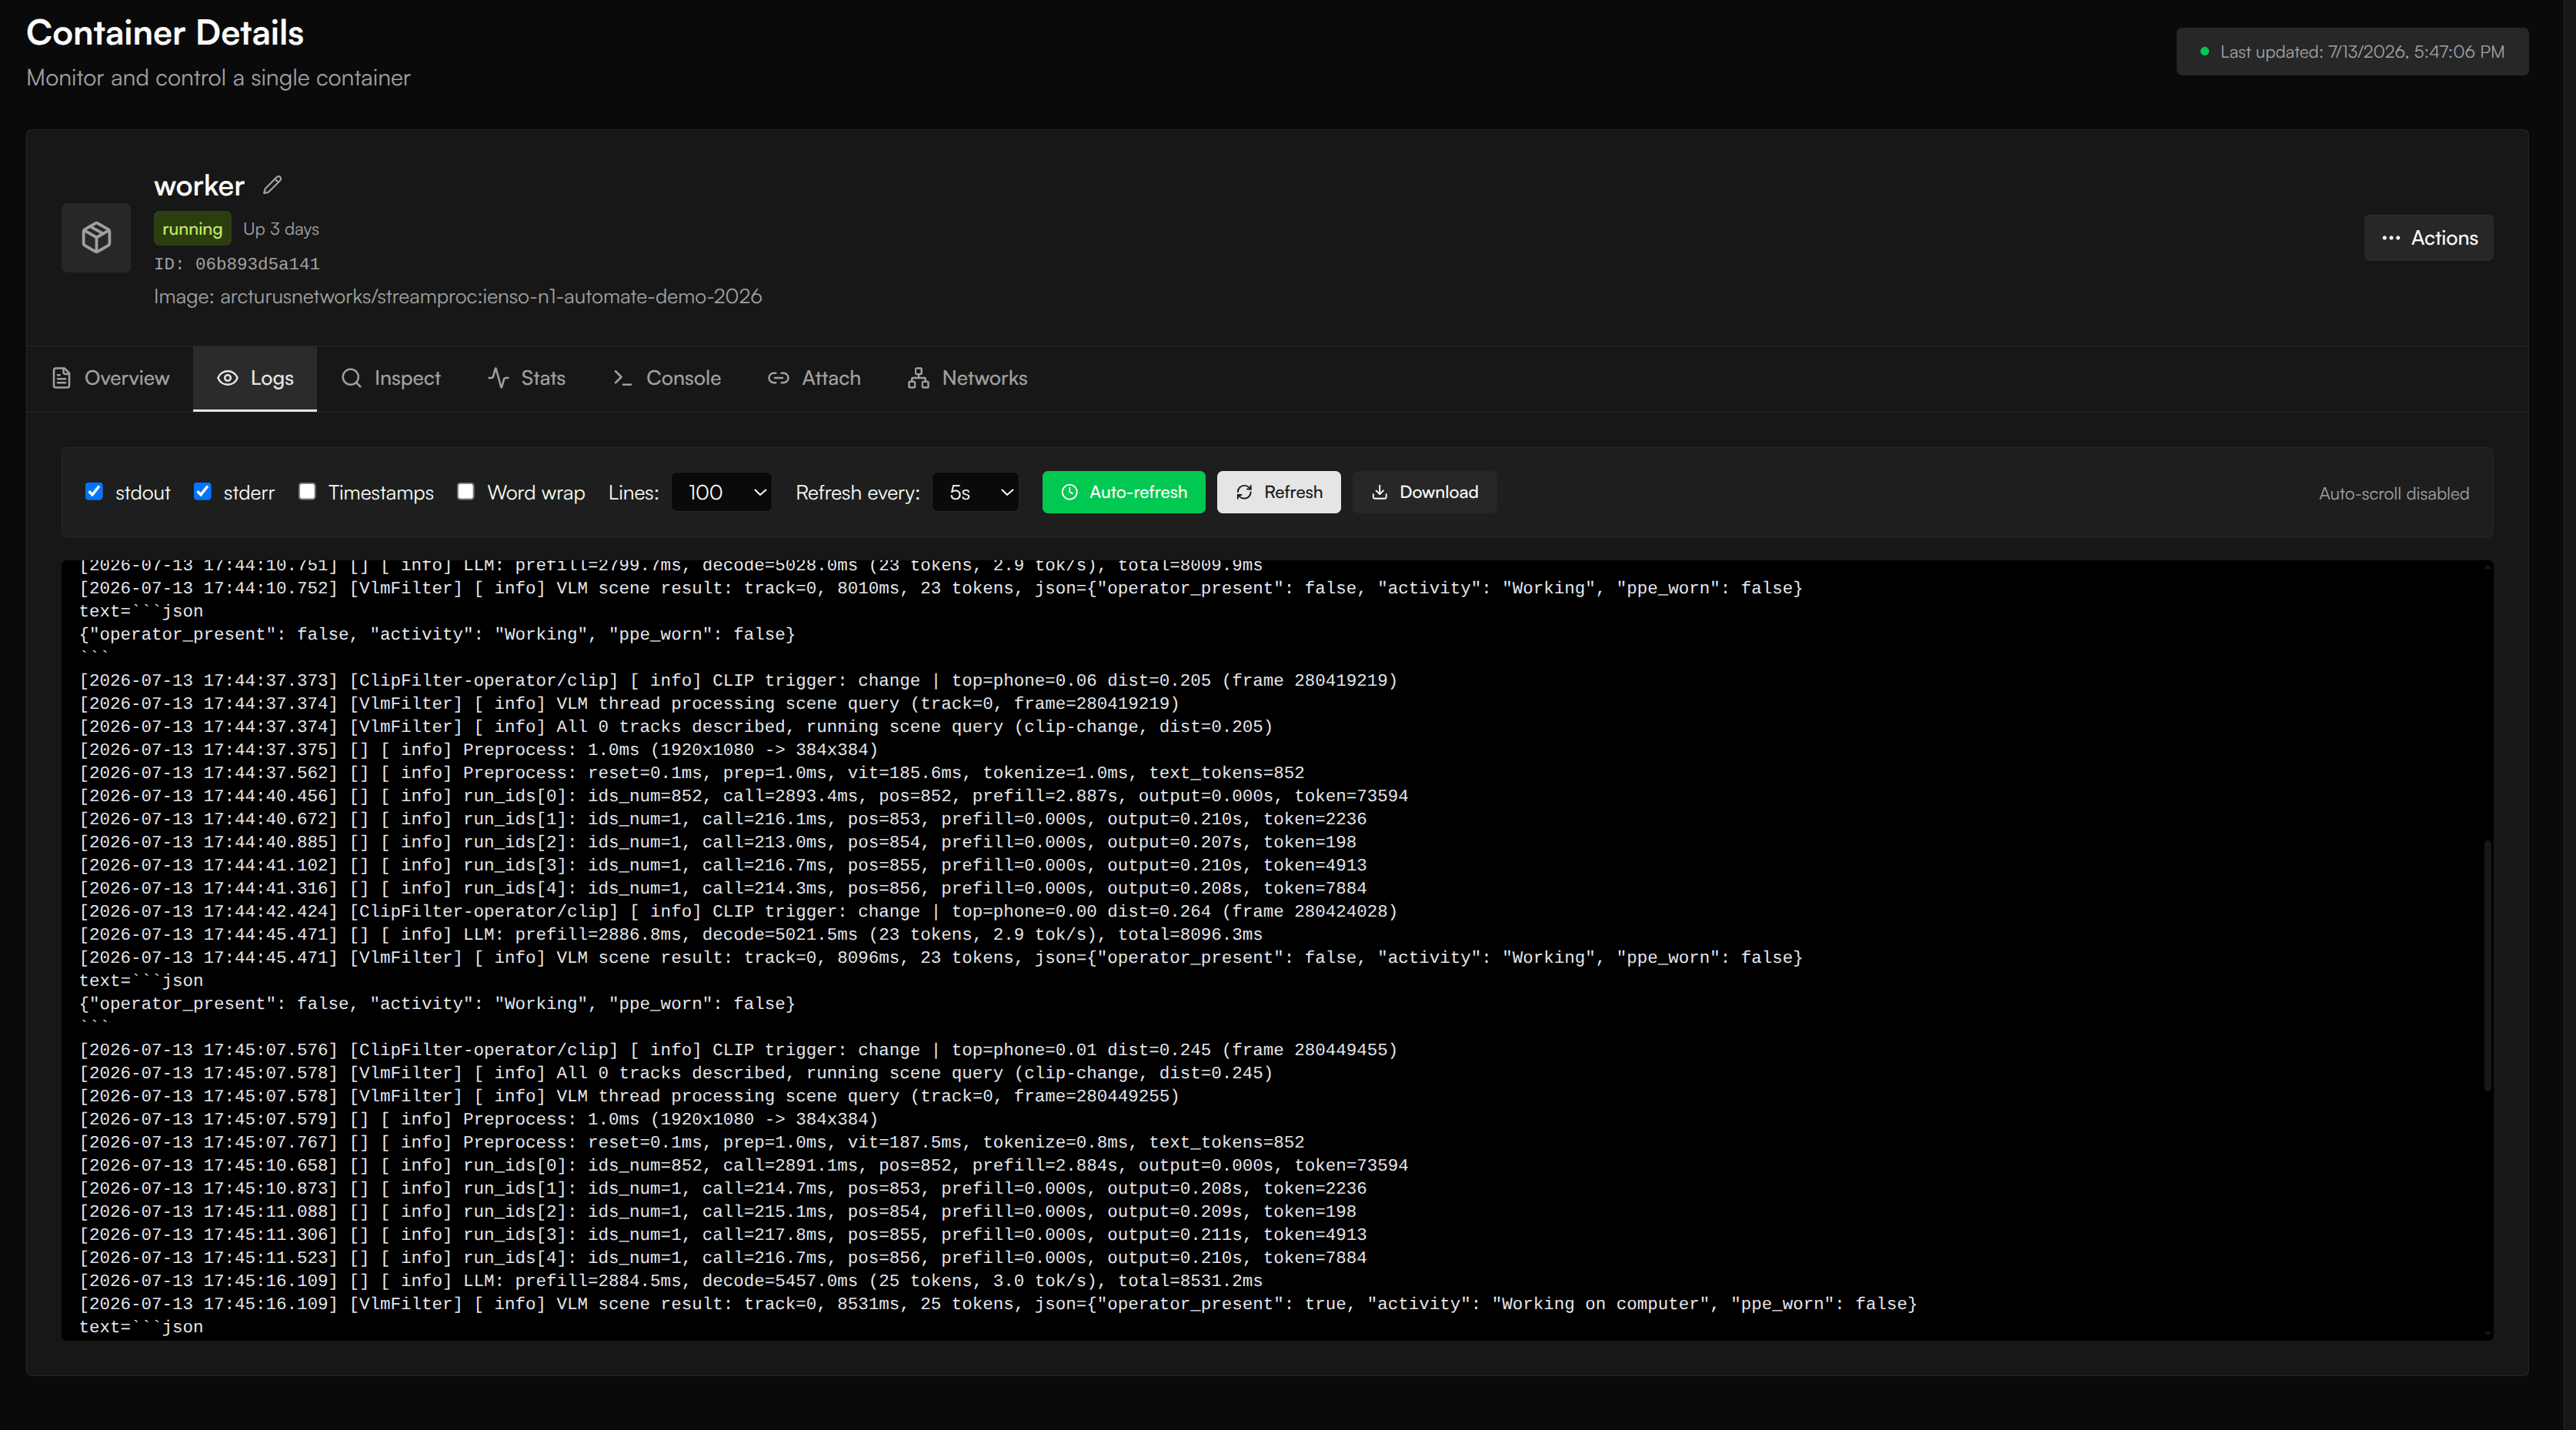
Container logs, streamed live from an edge device — with stdout/stderr filters, auto-refresh, and download.
Console
Need to poke around inside a running container? The Console tab gives you an interactive shell — pick the command (such as/bin/sh) and optionally the user, then Connect. It’s the equivalent of docker exec into the container, from the browser.
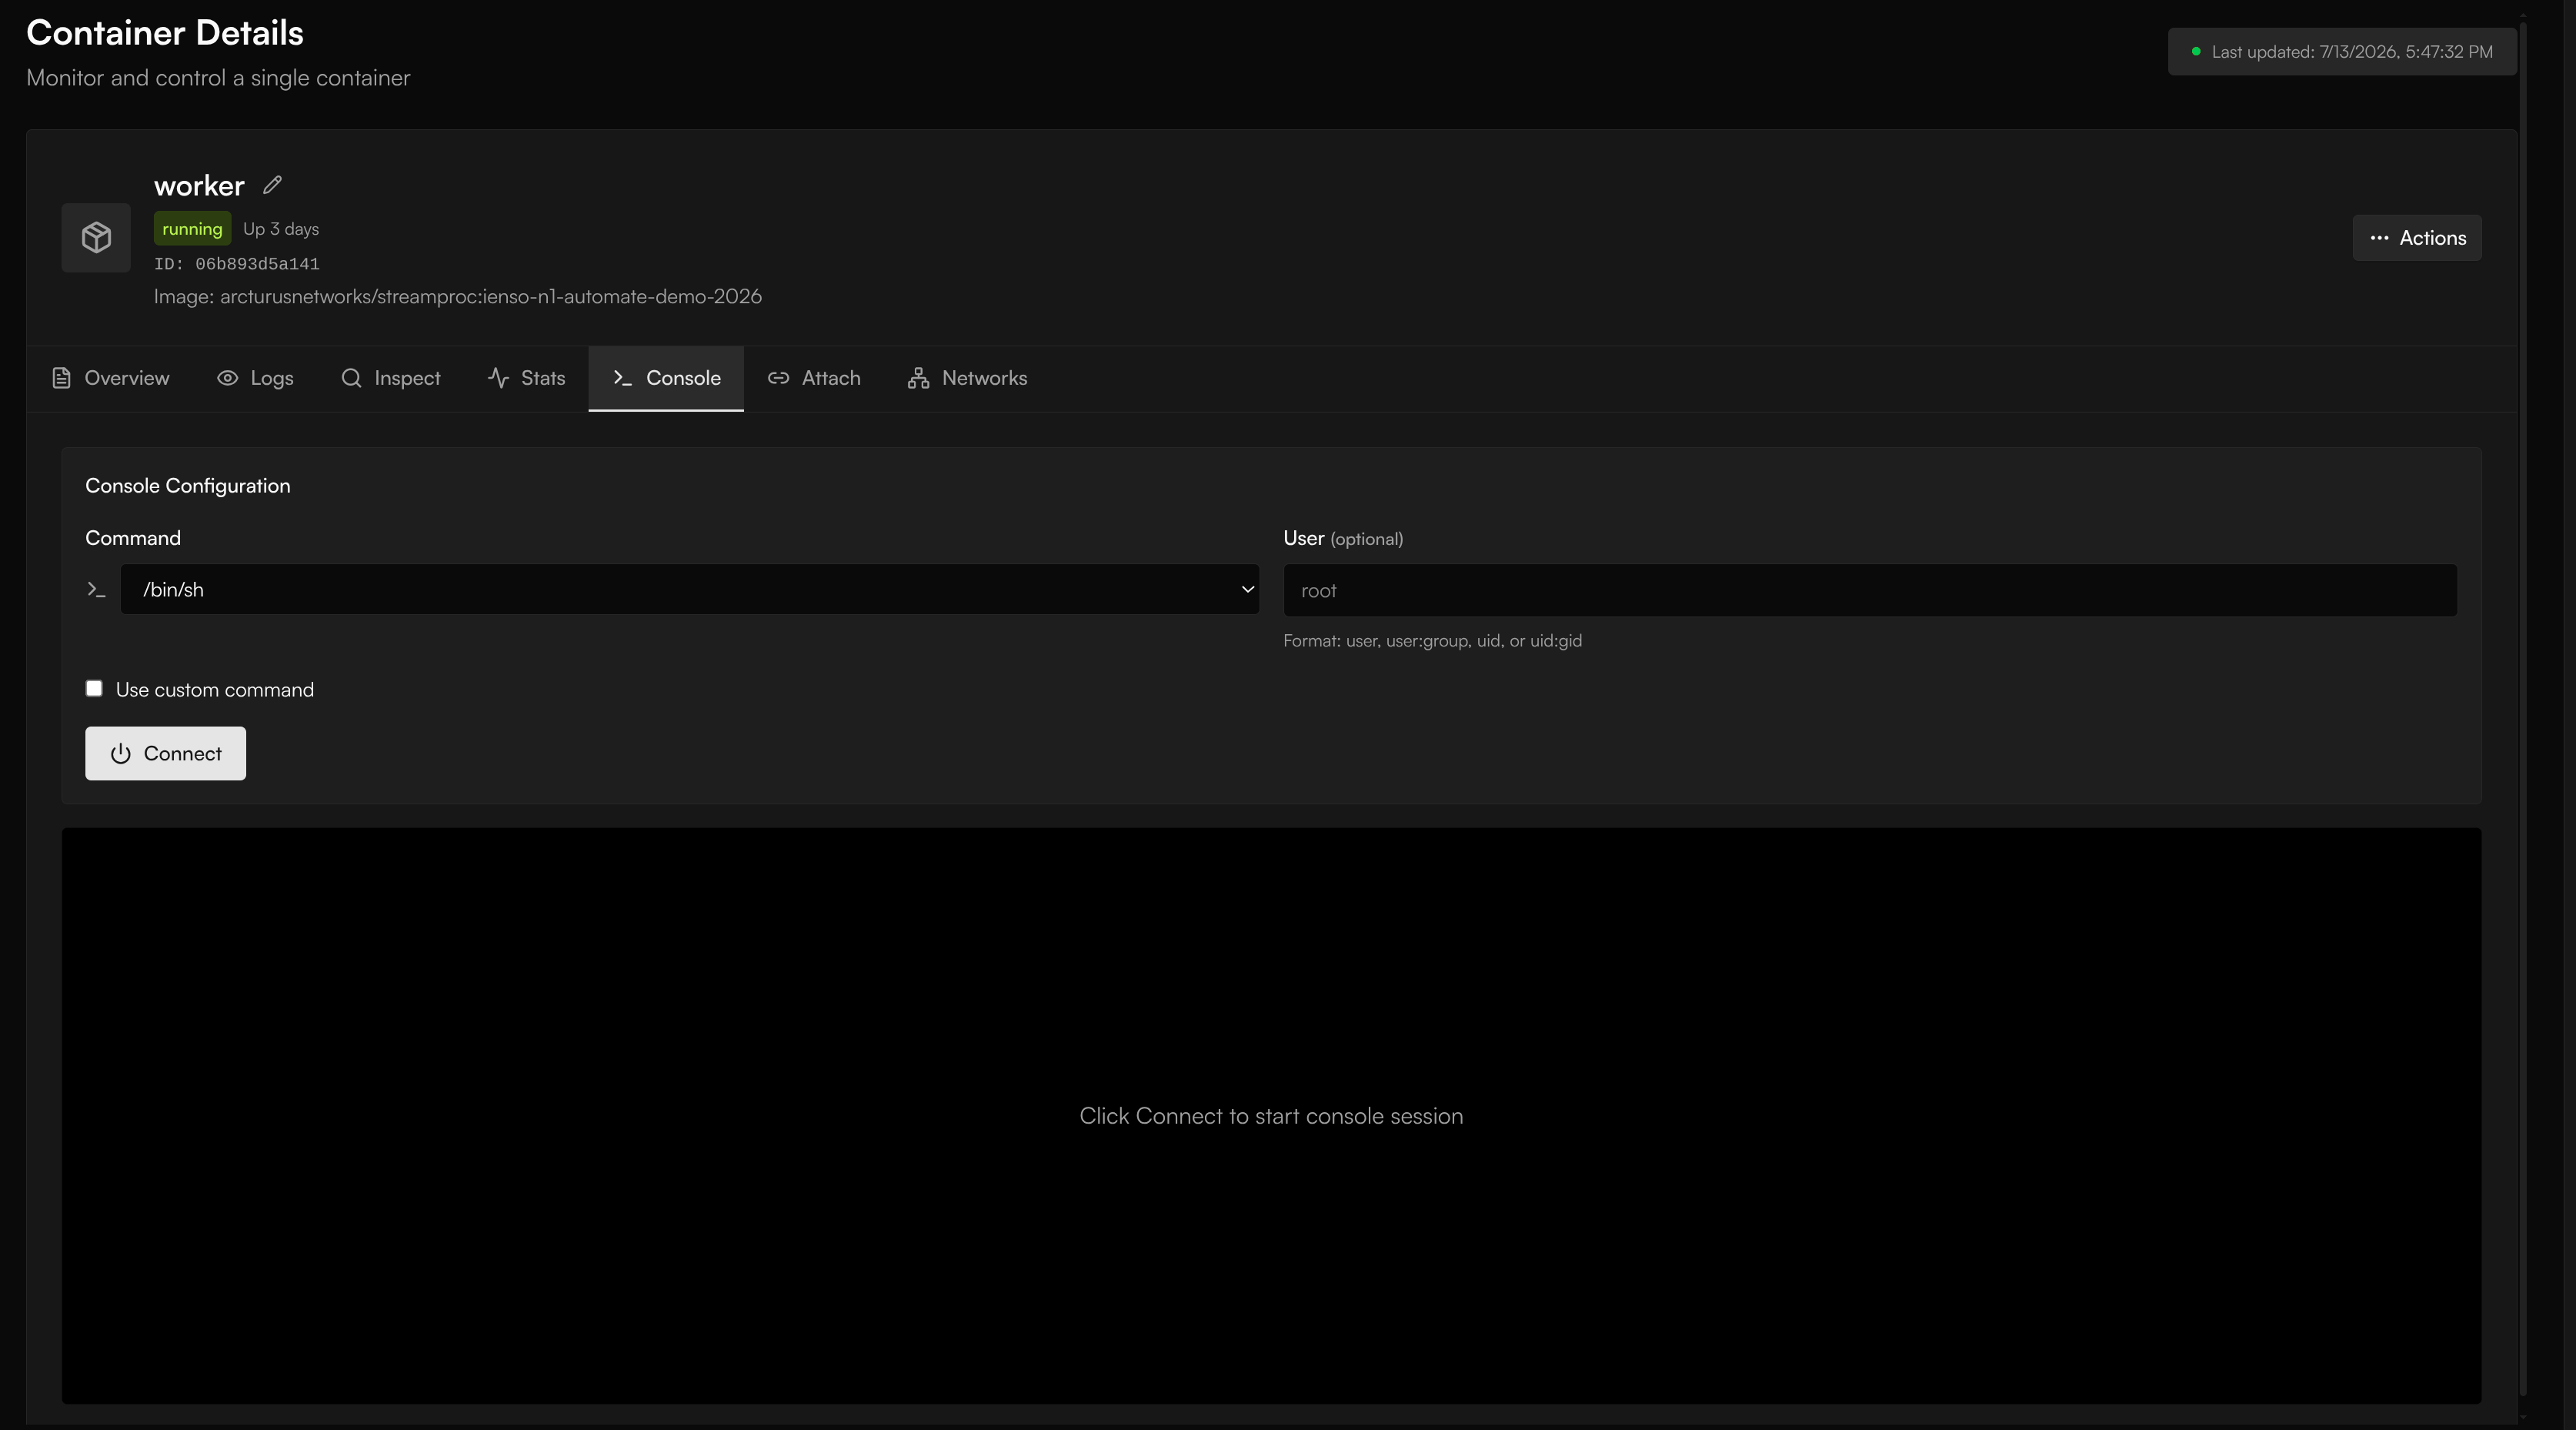
The Console tab — an interactive shell into a running container, straight from the dashboard.
Stacks
Devices that run a multi-container workload manage it as a stack (a Docker Compose deployment). From a stack you can:- View and edit its Compose definition and environment variables.
- Update to redeploy the stack with your changes.
- Stop and start the whole stack at once.
Images, volumes, and networks
The same views cover the rest of a device’s Docker resources — images, volumes, and networks — so you can manage a device end to end without a shell on the box.Container management rides the same outbound-only tunnel as everything else. The tunnel opens only when you actually view a device’s containers, stacks, or logs, and closes after a few minutes of inactivity — nothing on the device stays reachable between sessions. See Edge agent.
Next steps
Device settings
Configure a device’s video sources, zones, analytics, and network.
Reliability
What AcuSight runs for you, and what stays yours.