

Dashboards
Open Dashboards for live views of your fleet and models. Dashboards are tailored to your application — AcuSight supports manufacturing, security, pharmaceutical, and other verticals, each with its own views — plus MLOps dashboards that track model health across any application. The examples in these docs are from manufacturing:- Manufacturing — OEE across your fleet and per machine: overall equipment effectiveness, availability, performance, and quality, with trends over time.
- MLOps — how your deployed models are behaving over time, so you can spot drift.
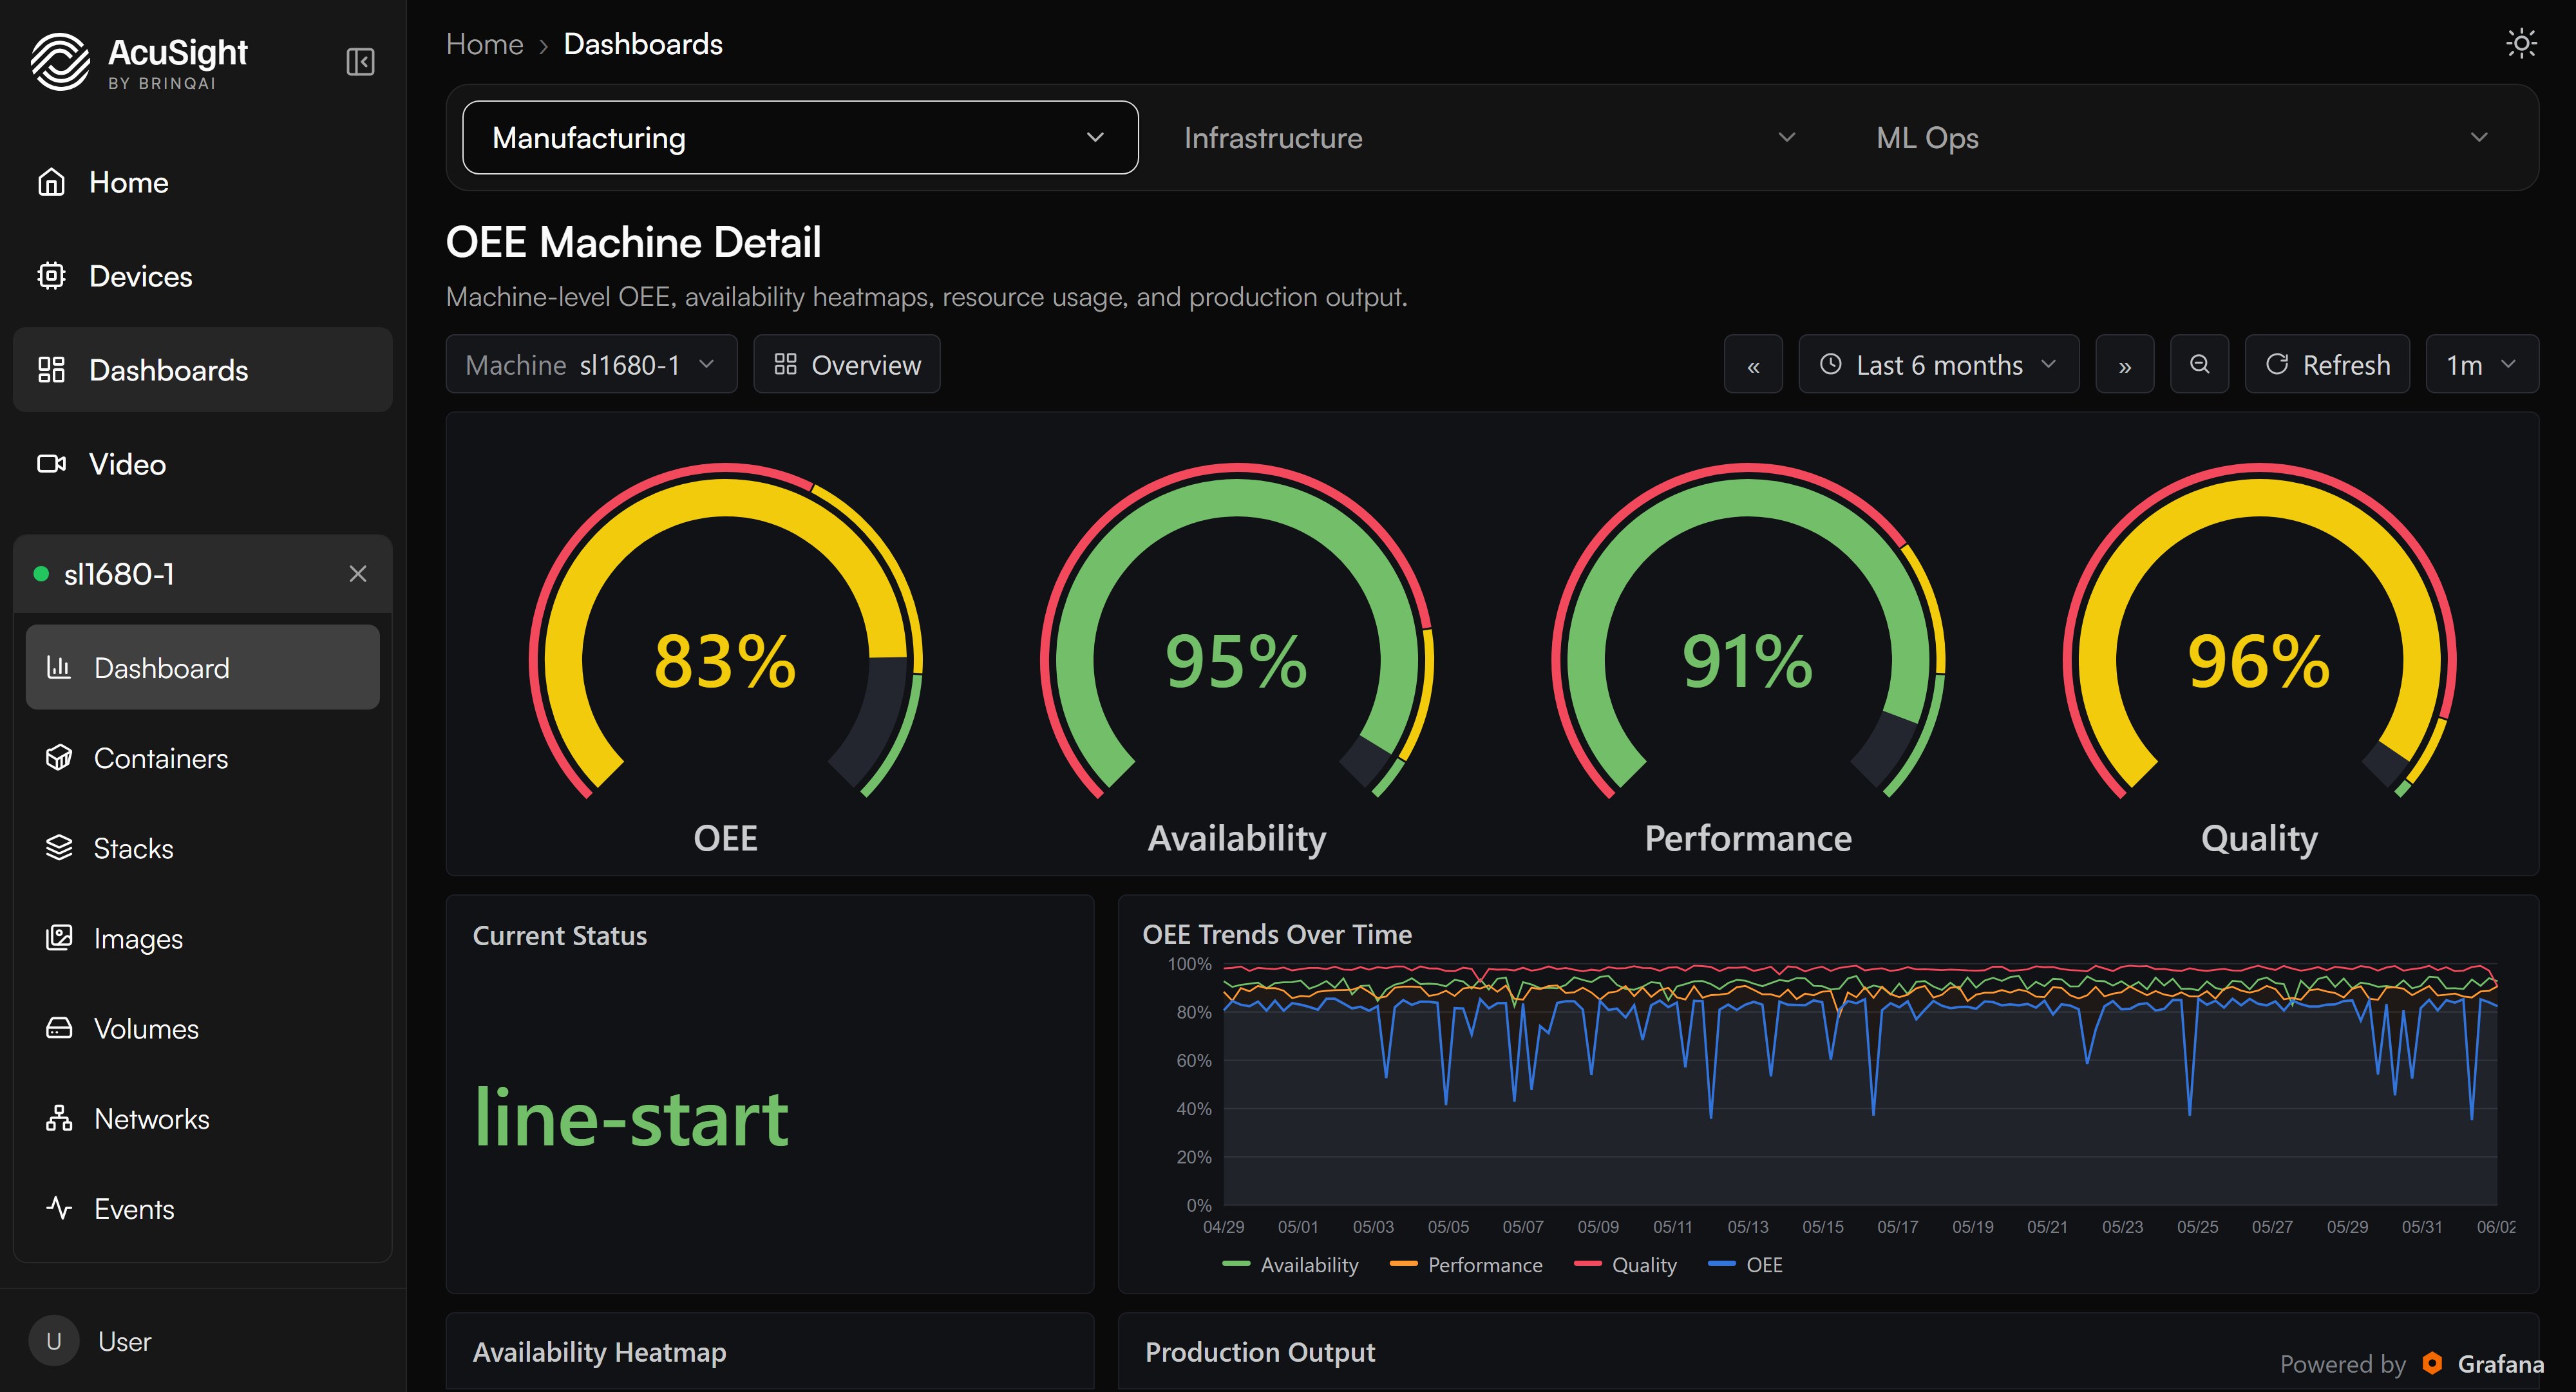
A manufacturing dashboard — machine-level OEE (availability, performance, and quality), with trends over time.
Drift alerts
Model behavior is watched continuously, and when a deployed model starts drifting — its predictions shifting away from what it was trained on — AcuSight raises a drift alert so the problem surfaces without you watching a screen. Open Drift Monitoring to see the state of your deployed models at a glance and work the alert queue:- Each alert carries a severity (high or warning) and the model and device it concerns.
- Alerts move through three statuses: drift detected (requires attention) → acknowledged (being investigated) → resolved. Acknowledge and resolve support bulk actions when a noisy model raises several at once.
- A drifting model is usually a retraining signal — collect fresh images from the affected line and see Model lifecycle for promoting a retrained champion.
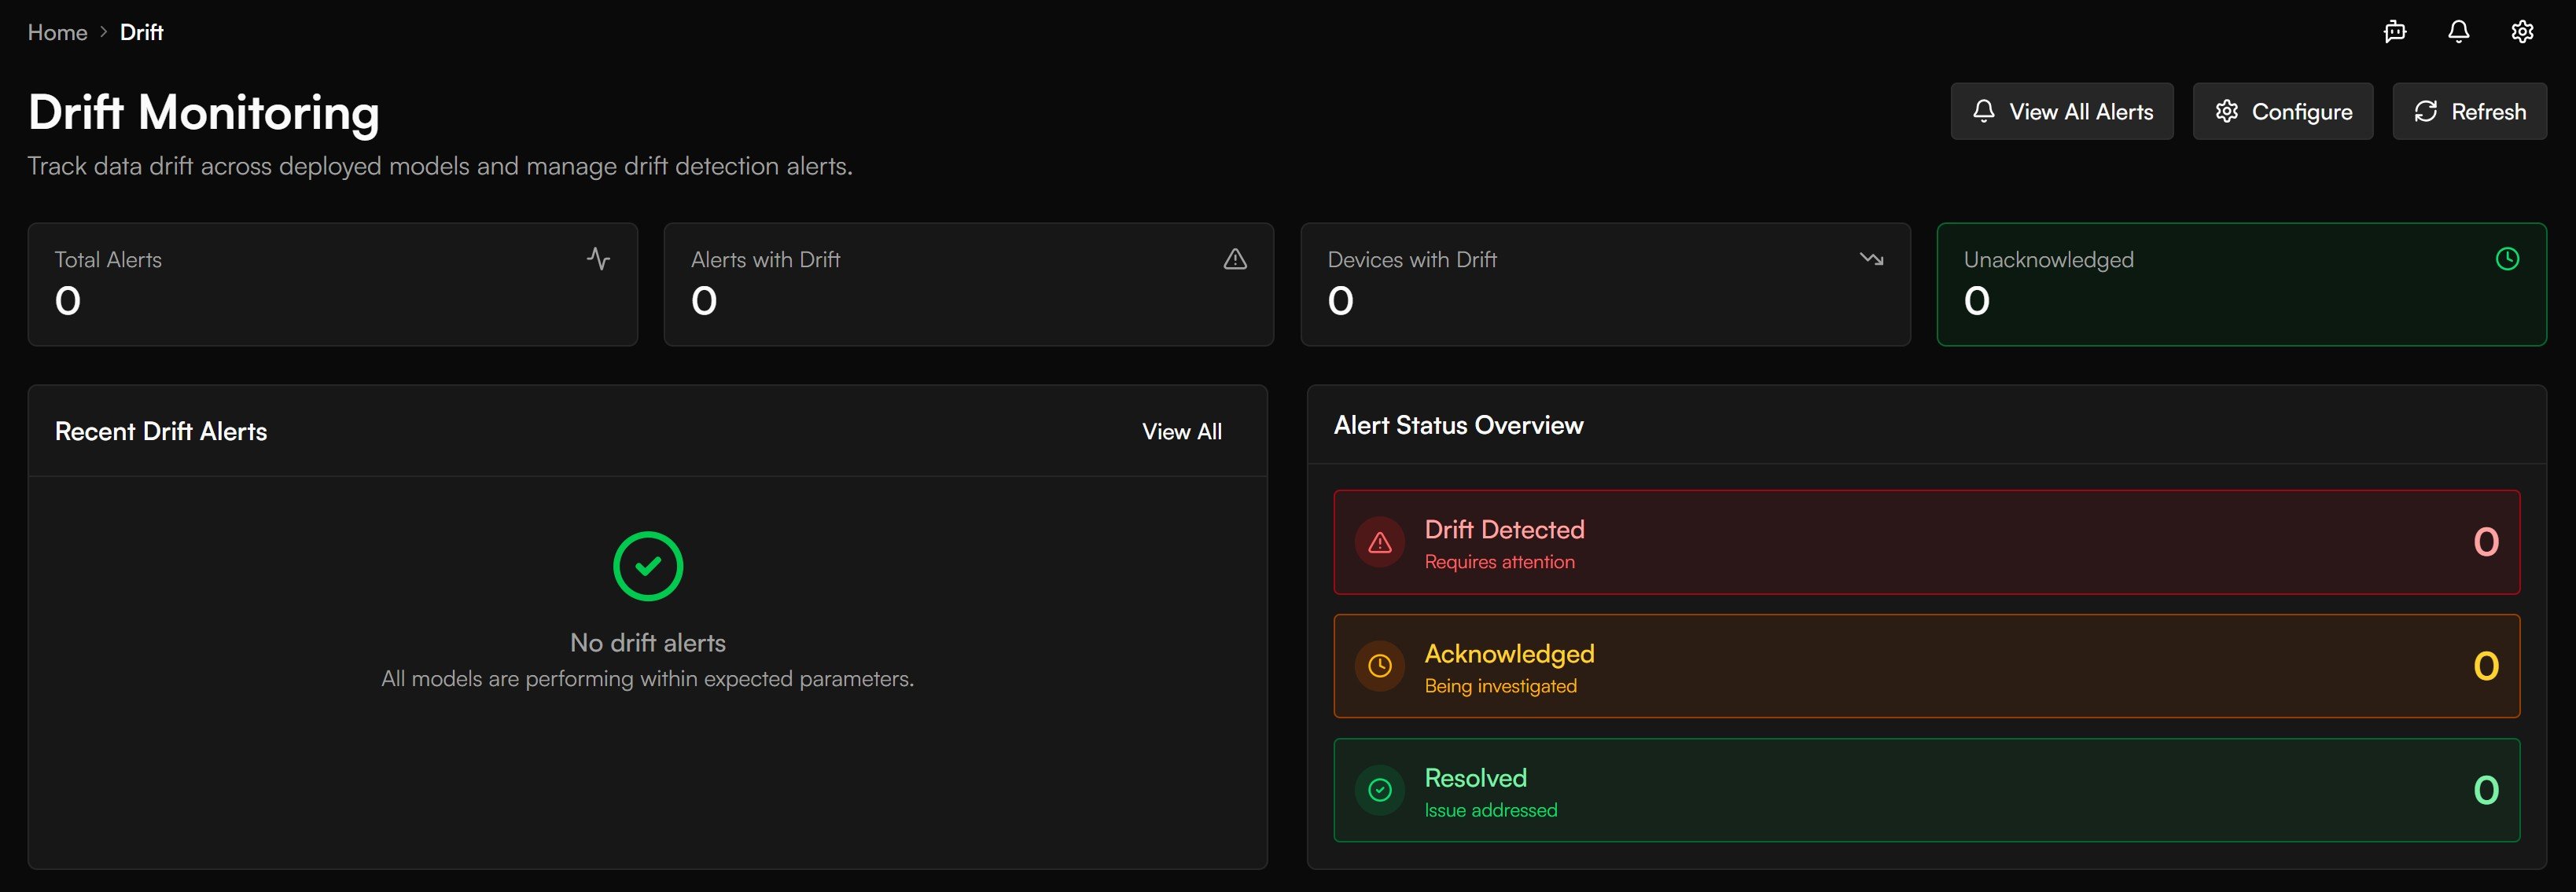
Drift Monitoring — alert counts across your deployed models, and the status of every alert. A quiet day.
The platform itself — servers, storage, and the metrics behind these dashboards — is run and maintained by AcuSight. See Reliability. Your dashboards focus on your fleet and models.
Next steps
Model evaluation
Dig into how a specific model is performing.
Reliability
How AcuSight keeps the platform healthy for you.